Historical Cash Rates & Median House Prices
We are living in a very interesting world, where I’m sure in 20 years’ time the ‘’experts’’ will be either saying how good we had it or what on earth where we thinking.
We believe that despite current asset values, yields, supply etc, etc we have tremendous Opportunity within Debt and Equity side of Real Estate Market in both an upward/downward scenario if your pragmatic and have a strategy in place for any change in landscape.
What can be challenging is looking at current asset prices vs historical basis for relative value purposes, everything appears expensive. I think the next phase of opportunity will be to keep your leverage under control/prudent level in order to have the ability to sustain any shocks that may be coming and or take advantage in a Volatile Market.
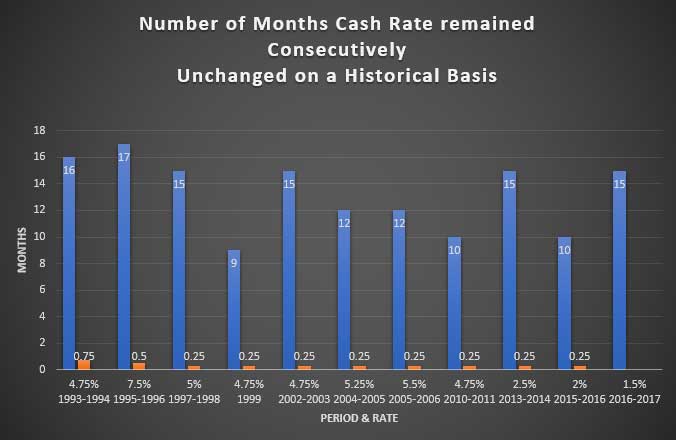
We were looking at historical cash rate from 1993-2017, See below (This may only be appealing to statisticians) and I was primarily looking for consecutive months of an unchanged cash rate. You can see we are reaching the resistance level 16-17 where it would appear based on history that current cash rate is due for a move (this is a hot topic, it’s nice to see this through simple historical data). We also looked at the immediate move post long run of unchanged cash rate and as you can see 25bps move was consistent theme.
It will be intriguing to see how the market reacts and what effect this has on asset prices once rates start move again.
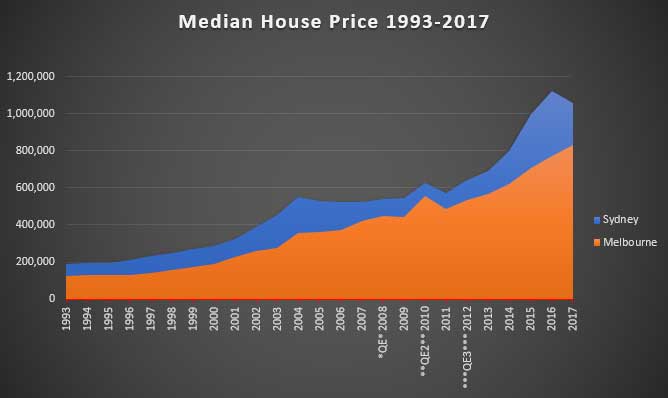
We also took a look at the Historical Median House Prices for Sydney and Melbourne (other states had less data, so we left them out). Its’s interesting to see the Dramatic effect that Global Quantitively Easing (QE) has had on Asset Prices. We looked at the US QE cycle and added when they were introduced, see below.
Where do you think the Cash Rate and Median House Prices will be at end 2018?
Do you have a strategy in place?
Data Source: RBA, 1970-1979 from Applied Economics (1991); 1980-2003 are from NSW VG / Department of Housing data. (b) 1970-79 are Productivity Commission data; 1980-2003 are Victorian VG data. (c ) 1973-79 are mean prices from Abelson (1982) factored down by 8% to fit REIA median data in 1980 and 1981; 1980-85, REIA data; 1986-2003, Queensland VG data (d) 1971-79 are mean values from Abelson (1981)Applied Economics (1991) reduced by 8% for medians; 1980-2003 are from SA VG. (e) 1970-89, based on REIA data. 1990-2003, average of quarterly data from the Department of Land. (f) 1971-81 are mean values (Abelson, 1982) reduced by 8%; 1982-83 are interpolated; 1984-90, CBA data spliced to 1991-2003 average quarterly REIA data.. (g) Average of quarterly medians from REIA. (h) 1971-80 are mean values from Abelson (1982) reduced by 9% for medians; 1981-2003 are average of quarterly REIA medians.
J.O.
“Prudential Finance does not provide financial product advice and does not hold an Australian Financial Services Licence. Prudential Finance recommends that investors consider their own Objectives, financial situation and needs before proceeding with any investment and seek professional advice. All information contained within this Website is specifically structured for corporate, business, commercial, construction clients, wholesale and professional investors.”
